
Your Cart is Empty


Procedural City Architecture: GIS/BIM Fusion, Rules-as-Code and KPI-Driven Generation
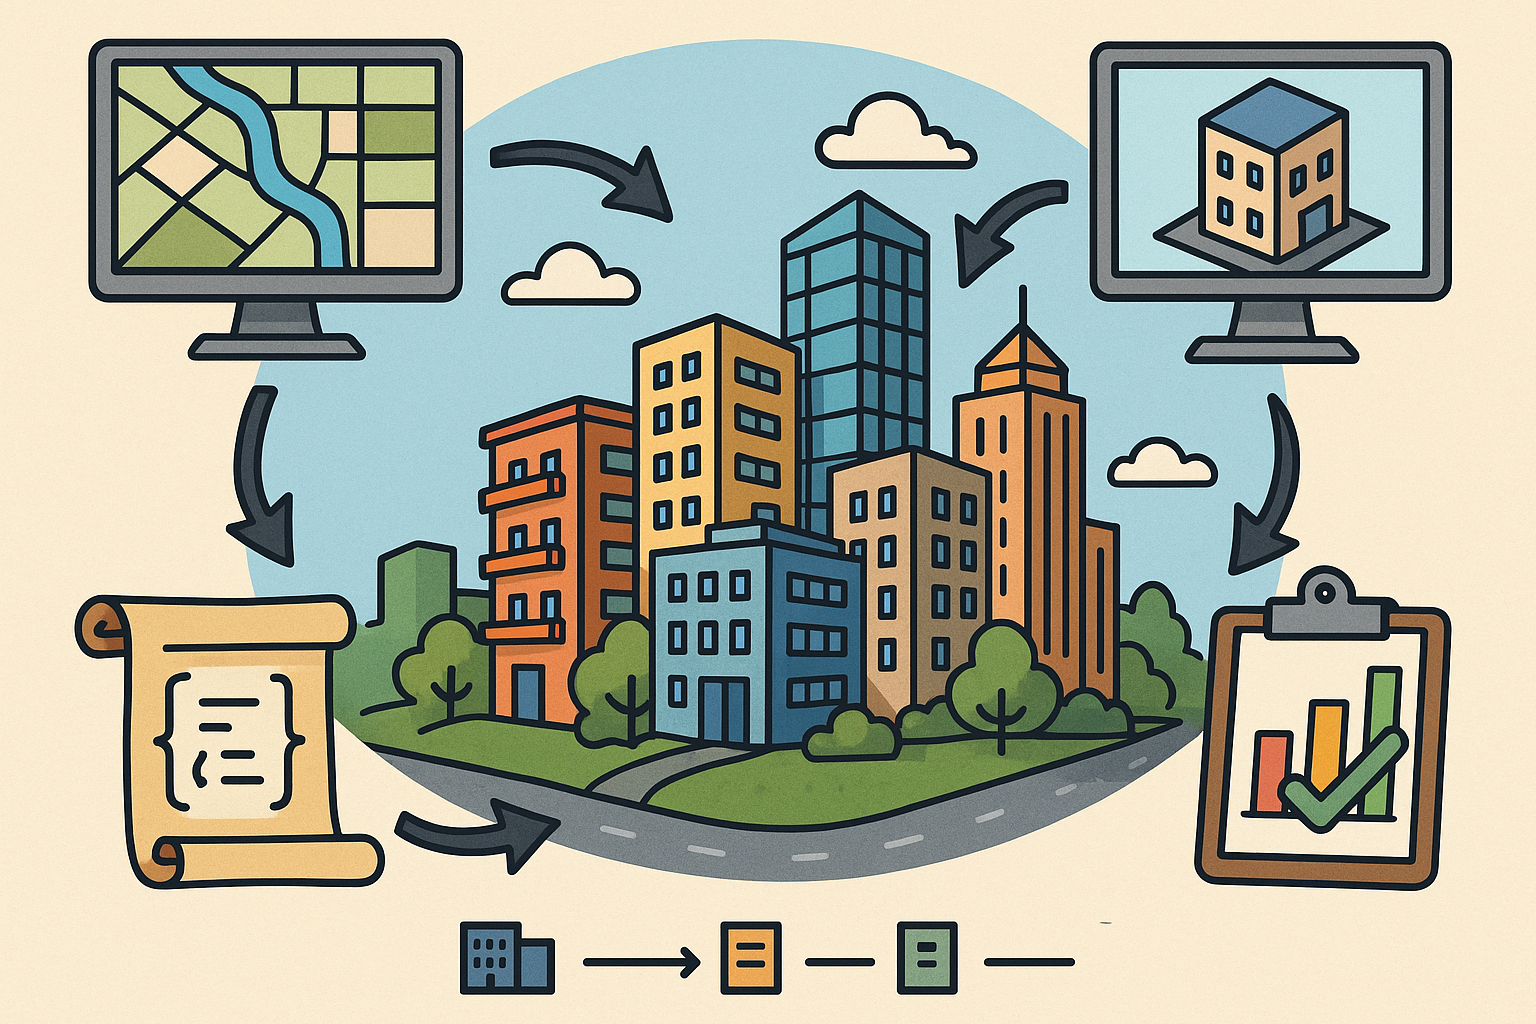


Procedural methods have matured to a point where city-scale design can be steered as a data-and-rules exercise rather than a sequence of brittle manual drawings. The purpose of this article is to present a rigorous, practitioner-focused blueprint that connects geospatial foundations with building information models, and closes the loop with analysis-driven generation. We will keep the framing light and focus on the mechanics: what to connect, how to encode rules, and how to compute Key Performance Indicators (KPIs) continuously. The result is a pipeline in which designers can move from metro-scale concepts to parcel-level development envelopes and building components in minutes, interrogate policy compliance as the geometry emerges, and iterate with confidence that they can round-trip to documentation platforms. By treating procedural architecture as a system of constrained transformations with measurable outcomes, teams can align stakeholders around reproducible scenarios, examine trade-offs before committing to costly refinement, and scale from test beds to whole regions without reinventing their stack. The emphasis here is on wielding semantics and compute wisely: fuse the right GIS/BIM layers, write rules as code, instrument KPIs, and stream the results to collaborative viewers. When those fundamentals are in place, the ambition shifts from producing isolated masterplans to cultivating a living, policy-aware parametric city twin.
Why Procedural Architecture for City-scale Design
From Rapid Iteration to Policy-Compliance
At city scale, the design challenge is not just drawing faster—it is iterating through many more degrees of freedom while keeping policy, infrastructure, and performance aligned. A well-structured procedural approach encodes policy and intent directly into generation rules so that every new scenario starts compliant by default. That means building in shape rules for policy-compliant massing, floor area ratio and gross floor area (FAR/GFA) accounting, and development envelopes tied to zoning text. When time-to-first-scenario drops from days to minutes, the conversation shifts from “what can we draw?” to “what outcomes do we want?” Beyond speed, the bigger payoff is reproducibility. Versioned parameter sets enable teams to re-run the same seed with updated assumptions—such as a new transit line or revised height limits—and objectively compare KPIs. This opens the door to running tens or hundreds of iterations, then filtering by targets such as density, daylight, or wind comfort thresholds. Crucially, policy-aware generators reduce downstream rework by surfacing conflicts early. Rather than discovering setbacks, easements, or right-of-way encroachments during documentation, the generator enforces these constraints as it subdivides lots, allocates typologies, and shapes towers. The “design intent” becomes a rule library that others can read, test, and refine, shortening onboarding and aligning multidisciplinary teams around a shared, executable playbook.
- Encode height, setback, and coverage as first-class parameters, not manual edits.
- Instrument GFA and FAR counters within the generation loops to prevent overbuild.
- Use deterministic seeds to ensure results can be re-run after policy changes.
Multi-scale Coherence and Levels of Detail
City-making is inherently multi-scale: region, district, block, parcel, building, and component must move in step. Procedural approaches excel when they are designed for multi-scale coherence, using consistent Levels of Detail and Information (LoD/LOG/LOI) to keep assemblies aligned while swapping representations by purpose. At regional scale, networks and terrain dominate; at district scale, subdivision and typology allocation matter; at block and parcel scales, envelopes and access logic take the lead; at building scale, floorplate logic and cores; and at component level, façades and systems. A robust scheme allows the same parcel to be represented as a polygon with development rights, as a 3D envelope with daylight planes, and as a building with room-level BIM—all linked by stable IDs. Designers can then decide which LoD to use for which computation, e.g., mobility at network LoD, energy archetypes at building LoD, or embodied carbon at material-class LOI. The other half of the equation is performance: the pipeline must swap heavy meshes for instanced proxies, employ LoD switching in viewers, and downsample to tiles for interactive streaming. With clear multi-scale contracts, you can validate each level independently, then compose them, confident that data lineage and identifiers will sustain updates over time.
- Define LoD/LOG/LOI expectations per scale and publish them with parameter schemas.
- Bind parcel, envelope, and building representations via persistent unique IDs.
- Use instancing and tile-based streaming to ensure responsive city-wide previews.
Urban Semantics as First-Class Data
Procedural city design thrives when urban semantics are explicit rather than implied. Networks, parcels, envelopes, and typologies each carry distinct behaviors and rules; when expressed in data, they can be transformed safely. Networks capture the graph anatomy of roads, transit, utilities, and pedestrian/bike systems, anchoring accessibility and capacity computations. Parcels model rights-of-way, easements, zoning overlays, and air-rights, clarifying what can be built and where. Envelopes express height, setbacks, daylight planes, FAR, and coverage rules as geometric constraints rather than post-hoc checks. Typologies map archetypes—residential, mixed-use, industrial—into parameter libraries for floorplates, cores, parking, and façade systems. The key shift is to treat these as interoperable layers, not static drawings. The generator consumes them, checks for conflicts, and balances competing claims. For example, a parcel with an air-rights transfer might drive a tower’s allowable GFA to shift parcels; a transit-oriented development overlay might tighten parking ratios or increase allowable height within a catchment; and utility capacities might constrain mixed-use intensity. Explicit semantics enable “rules as code” that apply predictably across a city. Once encoded, you can fold them into an optimization loop, sampling feasible massing, assigning archetypes to parcels, and testing outcomes against target KPIs—yielding faster feedback and fewer surprises.
- Model networks as attributed graphs with modes, speeds, and capacities.
- Represent overlays and easements as geometry with typed rights and constraints.
- Parameterize archetypes with configurable floorplate, core, and façade templates.
KPIs and Constraints in the Loop
Embedding KPIs into generative loops ensures you optimize toward outcomes, not just appearances. Early-stage counts—FAR/GFA, unit mix, and density—can be computed as geometry accrues, but high-value metrics should join the loop as surrogates or fast solvers: daylight/autonomy proxies, solar access, wind comfort via reduced-order models, noise exposure, viewshed coverage, and multimodal accessibility. Cost and embodied carbon can be estimated using material-class intensity factors tied to archetypes, while energy can be approximated using calibrated archetype loads. The trick is to calibrate the fidelity of each KPI to the decision at hand: use rapid approximations for inner loops and stronger simulations for pareto screening. When KPIs are first-class, constraint handling becomes systematic: reject massing that violates overshadowing windows, favor blocks that maximize transit catchments, or penalize podiums that exceed noise thresholds. Decision-making then becomes a multi-objective exercise: explore trade-offs among density, comfort, cost, and carbon, guided by NSGA-II or CMA-ES sampling, with constraint repair where feasible. Over time, KPI tooling benefits from continuous integration—golden scenes with known baselines that catch regressions—and from dashboards that show improvement per iteration. By building this muscle early, teams normalize the practice of “analysis-in-the-loop” and retire the pattern of last-minute compliance firefighting.
- Use surrogate models for daylight, wind, and noise to keep loops interactive.
- Tie cost and carbon factors to typology parameters for instant deltas.
- Adopt multi-objective search to visualize trade-offs and avoid single-metric bias.
GIS + BIM Data Integration Architecture
Data Sources and Cadence
A resilient city-generation pipeline begins with dependable inputs and predictable refresh cycles. Base layers include OSM for road geometry and tags, cadastral parcels, zoning shapefiles, CityGML for building stock, terrain via DEM/DTM, imagery in GeoTIFF, LiDAR in LAS/LAZ, and utility networks where permissible. On top of that, streaming feeds (WFS/WMS/Vector Tiles) and sensor telemetry keep the system current—especially in digital twins where traffic, occupancy, and microclimate readings influence scenarios. Library layers complete the system: national building codes, BIM templates, and materials catalogs map standards into machine-readable constraints. The cadence matters: some layers update quarterly (zoning), some daily (OSM edits), others in real time (sensors). Tying each source to a job schedule and tile index turns refresh into a routine rather than an emergency, and helps you maintain reproducible runs for historical what-if analysis. The goal is an ingestion mesh that can reassemble a metropolitan scene on demand with consistent GIS/BIM fusion, so that planners and architects can iterate without wondering if their data expired overnight. This cadence strategy doubles as a governance plan, defining who owns which feeds, how conflicts are reconciled, and what provenance is recorded for audit and attribution.
- Catalog sources with update frequency, license, and expected schema in a metadata registry.
- Automate pulls via WFS/WMS/tiles where possible; archive snapshots for time-travel.
- Bundle standards libraries (codes, archetypes, materials) with version tags.
Formats, CRS, and Semantics
Interoperability hinges on choosing the right formats and coordinate systems—and applying them consistently. Spatial data arrives as GeoJSON, Shapefile, GPKG, CityGML/CityJSON, 3D Tiles, b3dm, and glTF/GLB; BIM data travels as IFC (IfcSite/IfcBuilding/IfcSpace), Revit families, or USD with geospatial extensions. The first principle is to align CRS across layers: rely on EPSG codes, capture vertical datums (EGM96 or local geoid), and perform geoid-to-ellipsoid conversions where needed. Crucially, avoid geometric booleans in lat/long; perform buffering, clipping, and solids ops in a projected CRS appropriate to extent. Semantics require equal care: preserve CityGML LoD tags, map them deliberately to IFC LoD/LOG, and maintain typed attributes through conversions. USD can help assemble scene graphs and variants; 3D Tiles is the web-scale streaming format for large scenes; and IFC remains the lingua franca for round-tripping BIM semantics. A pragmatic pattern is to stage everything in a spatial database (PostGIS) with recorded CRS and units, then export to visualization or BIM on demand. Keep an eye on units—meters versus feet—and normal orientation, as these details quietly sabotage urban solids and analyses when neglected. Define a limited set of allowed formats per stage, and document conversions so that no one improvises a broken path under deadline pressure.
- Record CRS and vertical datum per layer; normalize before fusion.
- Use CityJSON/CityGML for stock LoD and IFC/USD for authored BIM and assembly.
- Limit on-the-fly reprojections in downstream apps; perform them during ETL.
ETL and Fusion Pipeline
Extraction, transformation, and loading (ETL) is the unsung core of city-scale design. Tools like GDAL/OGR, PostGIS, FME, pyproj, and PDAL for point clouds are the workhorses for converting, reprojecting, cleaning, and enriching data. Tippecanoe compresses vector tiles for web consumption, while tiling schemes such as S2/H3/quadkeys give you scalable indexing and consistent cache keys. The fusion stage is where semantics gain power: mapping OSM tags to BIM parameters enables instant assignment of curb types or bike lanes; linking CityGML LoD to IFC LOG stitches urban stock with design models; and attribute lineage plus persistent UIDs enable cross-domain joins. Building this as a tile-based system pays dividends: delta updates become cheap, caching is effective, and streaming to viewers becomes straightforward. Moreover, a pipeline that emits both analysis-ready geometries and visualization-efficient assets (e.g., glTF/3D Tiles) lets you thread the same data through simulation and stakeholder demos. Finally, think of the ETL pipeline as code: version control it, test it, and publish its schemas. With ETL as a governed service, design teams can focus on rules and exploration rather than hand-tuning imports for each project.
- Adopt tile-based caching; invalidate by tile on updates for predictable performance.
- Maintain attribute lineage to trace KPIs back to source layers and versions.
- Promote a shared semantic map: OSM tags → BIM parameters → analysis properties.
Data Quality and Validation
Urban pipelines often fail not for lack of ideas but due to low-level data defects. Topology issues—noding, snapping, duplicates, slivers, and broken polygons—propagate silently and explode in later stages. Solid modeling issues—non-watertight meshes, self-intersections, inverted normals, and unit mismatches—undermine daylight and wind analyses or cause crashes in viewers. A disciplined validation stage catches these early. Run topology repair on vectors, check manifoldness on solids, reorient normals consistently, and enforce unit hygiene. Equally important are provenance and licensing. ODbL/OSM attribution is a must; cadastral terms may restrict redistribution; utility data can include PII or sensitive infrastructure—handle accordingly. Teams should maintain a validation report per tile and per build: it is easier to quarantine a bad tile than to clean an entire metropolis. When your generator encounters a defect, it should fail loudly with actionable diagnostics instead of producing corrupt geometry downstream. Over time, build a library of “fixers” that normalize common local idiosyncrasies so that you can reuse them across cities. Data quality is not a one-time chore; treat it as a continuous service that guards your KPIs and preserves trust in the outputs.
- Automate topology fixers and solid checks as preflight steps before generation.
- Publish validation metrics per tile; block promotion to staging if thresholds fail.
- Track licenses and sensitivities; segregate restricted utilities from public scenes.
Procedural Generation and Compute Workflows
Rule Systems and Tooling
Choosing the right rule systems is a design decision as important as choosing a modeling tool. Shape grammars and CGA (e.g., CityEngine) excel at parcel-to-building pipelines, with readable production rules for subdivision, envelope carving, and façade tiling. L-systems cover vegetation, while grammar fusion bridges urban substrates to architectural detail. Node-based ecosystems open a broader toolset: Grasshopper—augmented with Elk/Urban Network Analysis/Ladybug—handles parametric logic tied to geospatial layers; Houdini SOPs and HDAs bring industrial-strength proceduralism and robust meshing; Dynamo links generations directly into Revit; Blender paired with Sverchok or Sorcar offers open-source flexibility. The connective tissue is “rules as code”: versioned libraries with tests, documentation, and parameter schemas (JSON/IfcPropertySets) that define how rules consume inputs and emit outputs. Design teams benefit when these rules are modular and composable: a lot subdivision rule that is independent of façade logic, a tower packing rule that can plug into multiple typologies, and a set of façade operators that understand context. Treat your rule library like a product—publish a changelog, deprecate responsibly, and ensure deterministic behavior for reproducibility. When rules are tested and documented, trust grows and experiments become safer and faster.
- Favor deterministic outputs for the same seed and input state to enable diffing.
- Publish parameter schemas with units, ranges, and defaults for safe reuse.
- Encapsulate rules as HDAs/plug-ins/packages to port across DCCs and engines.
Algorithms and Solvers
Under the hood, robust algorithms make or break city-scale generation. Network processing involves skeletonization and graph growth, space syntax metrics, and agent-based seeding for pedestrian or traffic flows. Geometry steps include computing setback envelopes, lot subdivision through medial-axis or straight-skeleton approaches, podium-tower splits, tower packing with clearance constraints, façade tiling aligned to story grids, and SDF/implicit operations for booleans that will not explode at scale. Optimization is the bridge between rules and outcomes. Multi-objective solvers such as NSGA-II and CMA-ES explore design spaces efficiently; constraint programming with OR-Tools enforces hard requirements (e.g., minimum parking or daylight compliance); surrogate models accelerate KPI evaluation in the loop. A robust loop might sample podium depths, tower aspect ratios, and façade porosity while penalizing overshadowing and maximizing transit catchments. The point is not to “solve” the city but to steer its high-dimensional design space with algorithms that scale and fail gracefully. By combining fast approximate evaluations with occasional high-fidelity checks, teams can converge on portfolios of promising scenarios rather than a single brittle winner, and thereby keep optionality alive until stakeholders commit.
- Use implicit/SDF booleans to avoid mesh fragility during envelope carving.
- Employ graph analytics to prioritize street hierarchy and pedestrian permeability.
- Blend global solvers with local heuristics to keep runtimes predictable.
Analysis-in-the-loop
Embedding analysis in the generation loop ensures form-making and performance evolve together. Solar and daylight analysis via Ladybug/Honeybee can provide rapid illuminance and access proxies; energy archetypes estimate loads by program without full BIM. Wind comfort can be approximated with fast RANS or surrogate models trained on representative typologies; noise mapping leverages traffic and transit sources over terrain; heat island indices tie material albedo to microclimate. Mobility and accessibility analyses compute multi-modal catchments, parking ratios, and curb management conflicts; small tweaks to curb use, protected bike lanes, or transit headways can ripple into development feasibility. Sustainability metrics connect typologies to embodied carbon estimators via material libraries and early-stage LCA stubs. The workflow pattern is simple: run cheap analyses in the inner loop for feedback, schedule heavier runs for pareto-front candidates, and cache expensive results keyed by tile and parameter hash. Designers can then filter scenarios by daylight sufficiency, wind comfort thresholds, and access to essential services, rather than relying on intuition alone. Over time, calibrate surrogates against measured data to improve trust. This turns analysis from a gate at the end of design into a co-author of geometry from the first iteration.
- Cache analysis results by spatial tile and parameter digest to prevent recomputation.
- Use archetypal energy and carbon models to rank options before detailed BIM.
- Integrate accessibility metrics to ensure density follows mobility capacity.
Interoperability and Deployment
A city-scale generator is only useful if it plays well with the rest of the stack. Round-tripping is essential: export/import IFC, maintain live Revit/Dynamo links for detailing, stream geometry and data via Speckle, assemble scenes with USD stages, and deliver web-scale views through Cesium/3D Tiles over terrain. Performance hinges on instancing, impostors, and LoD switching in viewers, as well as BVH/R-Tree spatial indices for fast selection and query. At compute level, GPU kernels (CUDA/Metal/WebGPU) accelerate distance fields and sampling; cloud batch and spot instances scale multi-objective runs; caching preserves expensive analyses; CI runs your rules against golden scenes to detect regressions. Governance and collaboration mirror software practice: Git(+LFS)/DVC track data and rules together; metadata catalogs describe assets; policy bundles package zoning updates; audit trails explain why a scenario scored as it did. When combined, these patterns produce reproducible, inspectable results that stakeholders can trust, while enabling designers to move fluidly between procedural and manual refinement. Treating interoperability as a first-class feature—not an afterthought—keeps the pipeline responsive and adaptable as standards evolve and the team scales.
- Adopt USD stages for assembly and variants; publish 3D Tiles for streaming to browsers.
- Use deterministic seeding and CI to guarantee stable results across environments.
- Version data + rules together; tie KPI dashboards to build hashes for auditability.
Conclusion
Key Takeaways
The central lesson is to treat city generation as a data + rules problem with KPIs embedded from the outset. Procedures that encode policies, rights, typologies, and assemblies produce massing that is policy-aware by default, saving cycles and reducing rework. The make-or-break foundation is robust GIS/BIM fusion: CRS alignment (including vertical datums), semantics preserved across formats (CityGML/CityJSON to IFC/USD), and persistent IDs that tie parcels to envelopes and buildings. Procedural rules, constraints, and optimization should co-exist in a tested, reproducible pipeline, with deterministic seeds and parameter schemas for safe reuse. Analysis-in-the-loop elevates performance to a co-driver of geometry; surrogates keep the loop fast, while heavier simulations validate final options. Interoperability is a product feature: plan for round-tripping, streaming, and assembly from day one. Finally, governance and collaboration—the same rigor seen in software—keep rules from drifting and ensure stakeholders can trace every KPI to a source and version. Put simply: encode intent, preserve semantics, compute continuously, and share transparently.
- Start compliant: policy in rules, not in review checklists.
- Fuse GIS/BIM with clear CRS and semantics; preserve IDs across transformations.
- Close the loop: KPIs and optimization within the generator, not after it.
Common Pitfalls
Several predictable hazards derail procedural city efforts. CRS and vertical misalignment tops the list: mixing ellipsoid heights with geoid-based DEMs skews elevations; running booleans in geographic coordinates leads to distorted buffers and fragile geometry—use a local projected CRS for geometry operations. Semantic loss between CityGML and IFC is another trap: if LoD and feature types are not mapped diligently to IFC LOG/LOI, downstream BIM loses meaning and analysis breaks. Fragile booleans on geographic meshes are notorious; prefer implicit/SDF operations and normalized units. Finally, drifting rule sets without tests erode trust: when a library update quietly changes setback behavior or FAR accounting, historical comparability collapses and stakeholders lose confidence. These pitfalls are avoidable with disciplined ETL, validation, and CI practices, but they require acknowledging that data management and rule governance are core design tasks, not overhead. Address them early and you safeguard performance, compliance, and credibility at metropolitan scales.
- Never boolean in lat/long; reproject before geometric operations.
- Map CityGML LoD and attributes explicitly to IFC LOG/LOI.
- Lock rule behavior with tests and golden scenes to prevent regressions.
Recommended Next Steps
To move from concept to capability, start small but build the scaffolding right. Establish a “rules-as-code” repository with CI that runs fixture datasets through your generator and checks KPI deltas against guardrails. Add a tile-based ETL that pulls OSM, parcels, zoning, terrain, and a seed CityGML/CityJSON stock, normalizes CRS, repairs topology, and publishes analysis-ready layers. Pilot an analysis-in-the-loop workflow focusing on solar and multimodal access, using archetype energy estimates and daylight proxies for fast feedback. Round-trip a handful of parcels into BIM: generate envelopes and basic floorplates procedurally, push them to Revit via Dynamo or Speckle, and export IFC back to the generator to confirm ID and semantic consistency. Publish a lightweight viewer via 3D Tiles that streams your tiles with LoD switching and instancing so stakeholders can interrogate scenarios quickly. As you harden the pipeline, layer in optimization (NSGA-II) and wind/noise surrogates, and expand the archetype library. The objective is not completeness on day one, but a reliable backbone that can absorb complexity incrementally without imploding under real-world data.
- CI with golden scenes; fail builds on KPI or topology regressions.
- ETL as code; tile caches with delta updates to keep sources fresh.
- Live BIM round-trips; validate IDs and semantics end to end.
Strategic Outlook
Standards and compute are converging to make parametric city twins truly interactive, policy-aware, and deployable at metropolitan scales. IFC is expanding its reach into site and infrastructure, USD is gaining geospatial extensions and powerful scene composition, and 3D Tiles is becoming the default for web-scale streaming. Together, these enable authoring, assembly, and visualization without custom glue at every handoff. On the compute side, GPU kernels (CUDA/Metal/WebGPU) make distance fields, sampling, and graph operations fast enough for in-browser experiences; edge compute can host localized analyses near sensors for digital twins; and cloud batch with spot instances makes multi-objective runs affordable. The next frontier is aligning urban policies with executable rulesets: cities will publish zoning and overlays as machine-readable bundles that generators can ingest directly, closing the loop from regulation to synthesis. With robust provenance and audit trails, scenario planning turns into governance with traceable decisions. Teams that invest now in GIS/BIM fusion, rules, and analysis instrumentation will not just draw cities faster; they will guide urban outcomes with transparency and precision, turning design conversations into measurable commitments that scale from district pilots to entire regions.
- Converging IFC + USD + 3D Tiles reduces friction from authoring to web delivery.
- GPU/edge compute unlocks interactive, analysis-aware city explorations.
- Machine-readable policy will turn rules into public infrastructure for planning.
Also in Design News