Your Cart is Empty


Design Software History: From Workstations to WebGL: The Evolution of Large-Scale Design Visualization


From Workstations to the Browser: Why Large-Scale Visualization Was Once Difficult
The workstation era and the economics of interactive graphics
Large-scale design visualization began as a privilege of organizations that could afford specialized computing rooms, dedicated graphics workstations, and engineers trained to operate them. In the 1980s and early 1990s, companies such as Silicon Graphics, Evans & Sutherland, Sun Microsystems, and Hewlett-Packard defined the practical limits of interactive 3D graphics. Silicon Graphics workstations, especially the IRIS, Indigo, Onyx, and Octane families, became symbols of high-end visualization because they paired proprietary graphics pipelines with operating systems and development tools optimized for real-time display. Evans & Sutherland had already built a reputation in flight simulation, military visualization, and vector graphics systems, while Sun Microsystems and Hewlett-Packard supplied technical workstations used in mechanical CAD, electronics, and engineering computation. These machines were expensive because they contained capabilities that ordinary personal computers lacked: accelerated geometry transformation, specialized rasterization hardware, high-resolution displays, large memory configurations, and robust UNIX environments. For aerospace, automotive, and architecture firms, the workstation was not a luxury accessory; it was the only practical way to rotate, section, shade, and inspect complex design data with tolerable performance.
Why CAD data resisted real-time visualization
The fundamental difficulty was that CAD geometry was created for precision, not necessarily for direct rendering. Mechanical systems were represented using mathematically exact boundary representation models, trimmed NURBS surfaces, analytic cylinders, cones, planes, and Boolean operations managed by solid modeling kernels such as Parasolid from Shape Data and later Siemens, ACIS from Spatial Technology, and kernels developed internally by companies such as Dassault Systèmes and Parametric Technology Corporation. To a CAD system, a machined bracket or turbine blade was a precise object governed by curves, surfaces, constraints, and topology. To a graphics system, however, it had to become triangles, normals, colors, materials, and display lists. Large assemblies multiplied that challenge dramatically. A commercial aircraft, automobile, process plant, railway station, or hospital building might contain millions of parts, many of them nested inside assembly structures and stored in proprietary formats. Before the web could become a visualization platform, the industry had to solve the basic problem of making engineering-accurate product data visually navigable without requiring every viewer to run the original authoring application.
The industrial pressure from aerospace, automotive, and infrastructure
Aerospace companies such as Boeing, Airbus, and Lockheed Martin pushed visualization forward because their products were too large and too interdependent for drawing-centric review alone. Boeing’s digital aircraft initiatives, Airbus’s distributed engineering teams, and Lockheed Martin’s defense programs all generated massive assemblies that required spatial understanding across structures, systems, wiring, interiors, tooling, and manufacturing planning. Automotive companies such as General Motors, Ford, Toyota, and BMW faced similar pressures, especially as body design, powertrain packaging, crash engineering, ergonomics, and supplier coordination became increasingly digital. Architecture and infrastructure created another category of scale. Bentley Systems, Autodesk, and Trimble served markets in which geometry was inseparable from schedules, geospatial context, structural data, and construction sequencing. In each industry, visualization became a way to align disciplines that did not use the same software. The need was not merely prettier images. The market demanded fast navigation through huge design contexts, selective disclosure of model information, and a way for people outside the CAD department to participate in technical review.
The practical barriers before browser-based access
Before web-ready visualization matured, sharing a large CAD model often meant moving a heavy file across a slow network, installing specialized viewers, translating proprietary data into intermediate formats, or physically gathering around a workstation. Network bandwidth was limited, especially before corporate wide-area networks and broadband internet became common. Graphics hardware was expensive, often tied to certified drivers and professional OpenGL cards from companies such as Silicon Graphics, 3Dlabs, NVIDIA, and ATI. Proprietary CAD formats further complicated the workflow because CATIA, Pro/ENGINEER, Unigraphics, I-DEAS, SolidWorks, AutoCAD, MicroStation, and Revit stored geometry and metadata in different ways. Even when a neutral exchange format such as IGES or STEP could move geometry, the result was often too heavy for wide distribution or too poor in assembly intelligence for meaningful review. The industry needed a shift from “send the entire design file and hope the recipient can open it” to deliver only the visual and informational representation required for the task. That historical shift eventually moved visualization away from specialized local machines and toward browser-based environments accessible through links, permissions, and streamed data.
- Early visualization depended on expensive workstation graphics, UNIX operating systems, and local high-performance storage.
- Large CAD assemblies were difficult because precision geometry had to be converted into renderable forms.
- Aerospace, automotive, architecture, construction, and infrastructure generated the scale that forced better visualization methods.
- The long-term direction was clear: visualization had to become distributable, lightweight, and independent of the authoring application.
The Technical Foundations: Tessellation, Streaming, Compression, and Scene Graphs
Tessellation as the bridge between exact design and interactive display
The foundation of large-scale visualization is tessellation, the process of converting exact CAD geometry into polygonal meshes that graphics hardware can draw quickly. A trimmed NURBS surface in CATIA, NX, Creo, SolidWorks, or Inventor may be mathematically elegant, but a GPU expects triangles. Tessellation decides how finely curved surfaces should be approximated, how edges should align, how gaps should be avoided, and how much visual fidelity should be preserved. A coarse mesh loads faster and renders with fewer polygons, but it may make circular holes appear faceted or make aerodynamic surfaces look crude. A fine mesh preserves appearance but can explode file size and stress memory. This tradeoff became central to every large-model viewer. Companies building visualization pipelines had to choose tolerances based on model scale, zoom level, curvature, and the intended use of the view. An aircraft fuselage, a turbine blade, a medical device housing, and a city infrastructure model all require different tessellation strategies. This is why visualization is not a simple export button; it is a controlled interpretation of design intent into graphics data.
Level of detail and the discipline of not drawing everything
As models grew, the most important performance lesson was that interactive visualization depends on deciding what not to draw. Level of detail techniques allow a system to show simplified representations when objects are far away and more detailed meshes when the user zooms in. Geometry simplification removes unnecessary vertices, merges small features, suppresses hidden parts, and sometimes replaces complex assemblies with bounding boxes or symbolic proxies. Spatial indexing divides a model into regions so the viewer can quickly determine which objects are visible, nearby, hidden behind other objects, or outside the camera frustum. This thinking was familiar in simulation and computer graphics, but engineering design gave it a stricter purpose because users expected identifiable parts, accurate spatial relationships, and trustworthy measurements. A plant model, for example, might contain pipes, valves, structural members, cable trays, pumps, instruments, and access platforms. Drawing all of it at full fidelity at all times would waste processing power. The essential breakthrough was progressive visual intelligence: show enough to orient the user immediately, then refine detail as needed.
Scene graphs and the management of model hierarchy
Scene graphs became a crucial organizing idea because large engineering models are not just heaps of triangles. They contain product structures, assemblies, subassemblies, parts, instances, transformations, metadata, visibility states, materials, and relationships. A scene graph provides a hierarchical abstraction for managing this complexity, allowing software to traverse only relevant branches, apply transformations efficiently, hide or isolate systems, and associate graphical objects with engineering information. Open Inventor, originally associated with Silicon Graphics, helped popularize scene graph concepts in technical visualization. OpenGL, standardized in the early 1990s, supplied a widely adopted low-level graphics API that allowed CAD and visualization vendors to target hardware acceleration across different systems. Visualization toolkits built on top of these foundations reduced the burden for application developers. Tech Soft 3D’s HOOPS technology became especially influential because it provided graphics and visualization infrastructure for engineering software companies that did not want to build every rendering, selection, hidden-line, and model-management capability from scratch. In this period, the industry learned that large-scale visualization required both fast pixels and sophisticated model organization.
Early web 3D experiments and their limits
The web’s first attempts at 3D were ambitious but premature. VRML, introduced in the mid-1990s, imagined a web of navigable three-dimensional worlds, while X3D later attempted to modernize and standardize that vision. Java 3D and browser plug-in approaches tried to bring interactive graphics into internet-era applications, often relying on installed runtimes, applets, or proprietary extensions. These technologies were historically important because they proved that 3D could be embedded in networked environments, but they struggled with deployment friction, inconsistent performance, security concerns, weak tooling, and limited integration with professional CAD translation. Engineering users did not simply need spinning objects on a web page. They needed massive assembly structure, part selection, measurement, sectioning, property inspection, markup, permissions, and reliable rendering across machines. The browser environment of the time was not ready. JavaScript engines were slower, GPU access was limited, and corporate IT departments were cautious about installing plug-ins. The result was a transitional era in which the concept of web-based visualization existed, but the practical infrastructure was not yet mature enough for daily engineering work.
Lightweight formats and the rise of shareable representations
Several formats emerged to make design data more shareable without exposing the full weight of authoring files. Siemens’ JT format became highly significant in manufacturing because it allowed lightweight product visualization, assembly navigation, and collaboration across complex product structures. JT could carry tessellated geometry, product structure, metadata, and sometimes precise B-rep information, making it useful in product lifecycle management environments associated with Teamcenter and large manufacturing supply chains. Autodesk’s Design Web Format, or DWF, served a similar sharing-oriented mission for AutoCAD and later design workflows, allowing drawings and models to be reviewed without requiring the original authoring software. 3D PDF, supported through Adobe’s PDF ecosystem and technologies from companies such as TTF and later Tech Soft 3D, helped package 3D models into a document format familiar to business users. These formats addressed a key historical need: firms wanted a controlled representation that was smaller, easier to distribute, and safer than native CAD. They also revealed the deeper challenge of visualization: the central question was not only how to render geometry, but what data to send, when to send it, and how much fidelity to preserve.
- Tessellation converted exact CAD surfaces into renderable triangle meshes.
- Level of detail, simplification, and spatial indexing made large models manageable.
- Scene graphs organized geometry, hierarchy, metadata, transformations, and visibility.
- VRML, X3D, Java 3D, JT, DWF, 3D PDF, HOOPS, and OpenGL each contributed part of the historical foundation.
WebGL, Cloud Platforms, and the Breakthrough of Interactive Web Visualization
How WebGL changed the meaning of the browser
WebGL changed the browser from a document viewer into a real-time 3D graphics platform. Based on OpenGL ES concepts and exposed through JavaScript, WebGL allowed web applications to use GPU acceleration without relying on traditional plug-ins. This mattered enormously for engineering visualization because deployment friction had always been one of the greatest obstacles. If users had to install a specialized viewer, configure graphics drivers, request IT approval, or obtain a license for an authoring system, collaboration slowed down. With WebGL, a browser tab could become a viewport. The improvement was supported by faster JavaScript engines such as Google’s V8, Mozilla’s SpiderMonkey, and Apple’s JavaScriptCore, alongside broader browser APIs for typed arrays, asynchronous loading, workers, local caching, and responsive user interfaces. GPU vendors such as NVIDIA, AMD, and Intel also made accelerated graphics more common in ordinary laptops and desktops. The browser did not instantly replace heavyweight CAD, but it became credible for design review, model inspection, coordination, and immersive navigation. The result was a decisive step toward interactive 3D as a standard web capability.
Cloud translation and progressive model delivery
The cloud transformed visualization because it moved the hardest preparation work away from the user’s device. Instead of forcing every client machine to translate native CAD files, cloud services could perform server-side translation, tessellation, hierarchy extraction, metadata indexing, and derivative generation. This approach let web viewers load optimized visual representations rather than raw authoring files. Progressive loading became essential: a user could open a model, see an initial representation quickly, and then receive additional geometry, textures, properties, and detail as navigation continued. Model streaming replaced the older assumption that a viewer must download an entire file before interaction begins. Permissions also became part of the viewing environment. A supplier, contractor, executive, architect, manufacturing planner, or field engineer could be granted access to specific models or portions of models without copying the complete design archive. This was a profound workflow change. Visualization was no longer a detached afterthought at the end of design; it became a managed cloud service connected to identity, storage, translation, markup, versioning, and collaboration.
Autodesk Forge Viewer and the platformization of design viewing
Autodesk Forge Viewer, now associated with Autodesk Platform Services, became one of the most visible examples of web visualization as a developer platform. Autodesk had long experience with DWG, DWF, AutoCAD, Inventor, Revit, Navisworks, and cloud collaboration products, and Forge brought that ecosystem into a web services model. The viewer could display 2D and 3D design derivatives, support selection, property inspection, sectioning, measurement, isolation, theming, and extensions written by developers. Its significance was not merely that it displayed models in a browser. It exposed visualization as an embeddable layer inside custom workflows for construction coordination, facility management, product review, asset tracking, and design automation. Revit and Navisworks data, in particular, showed why web viewers needed to understand building information rather than only surfaces. A wall, duct, pump, beam, or room could carry identity, classification, parameters, and relationships. By making this accessible through a browser interface and APIs, Autodesk helped normalize the idea that design data could be navigated, queried, and discussed without opening the original desktop application.
Browser-native CAD and the Onshape shift
Onshape, founded by former SolidWorks leaders including Jon Hirschtick, John McEleney, Scott Harris, and others, represented a more radical change because it treated the browser not only as a viewer but as the operating environment for CAD authoring. Acquired by PTC in 2019, Onshape demonstrated that professional parametric modeling, assemblies, data management, and collaboration could be delivered as a cloud-native service. Its relevance to large-scale visualization is partly architectural. Because the model lived in the cloud, viewing and collaboration were not separate export events; they were part of the same environment. Users could share documents, manage versions, branch designs, and review geometry without sending large files through email or file transfer systems. Onshape’s approach also highlighted a cultural shift in engineering software: the browser no longer implied a lightweight toy. It could host serious design interactions when backed by server-side computation, accurate modeling kernels, and carefully engineered graphics delivery. The broader market learned from this that visualization and authoring would increasingly overlap, especially as teams demanded real-time collaboration rather than sequential file exchange.
Specialized web visualization ecosystems
Several other platforms broadened the meaning of web-ready visualization. Sketchfab made browser-based 3D publishing accessible to artists, designers, cultural institutions, and product teams, helping popularize the idea that a 3D model could be shared as naturally as a video. Trimble Connect addressed construction and BIM collaboration, where models from architects, engineers, contractors, and fabricators had to be federated and reviewed across project teams. Dassault Systèmes’ 3DEXPERIENCE platform extended the company’s CATIA, ENOVIA, SIMULIA, DELMIA, and SOLIDWORKS ecosystems toward cloud-connected collaboration, simulation, manufacturing planning, and product experience. Bentley Systems’ iTwin platform focused on infrastructure-scale digital twins, combining engineering models, reality data, geospatial context, and change tracking for bridges, roads, rail networks, plants, campuses, and cities. These platforms served different markets, but they shared a common historical lesson: web visualization becomes valuable when it is tied to information, workflow, and governance. A spinning mesh is useful for communication, but an information-rich model connected to permissions, issues, versions, assets, schedules, and analytics becomes a strategic design environment.
BIM, digital twins, and factory layouts as scale multipliers
BIM, digital twins, and factory layouts forced web viewers to support entire information-rich environments rather than isolated objects. A BIM model is not merely a geometric representation of a building; it contains rooms, systems, equipment, materials, phases, parameters, classifications, and discipline-specific views. A digital twin may combine design geometry with sensor feeds, maintenance records, geospatial coordinates, inspection imagery, and simulation results. A factory layout can include robots, conveyors, safety zones, workcells, racks, utilities, logistics paths, and production constraints. These environments made large-scale visualization historically more demanding because users needed to navigate space and data simultaneously. Web viewers had to support filtering, search, object metadata, markup, issue tracking, clash context, measurement, section planes, saved views, and sometimes time-based simulation. The challenge was no longer limited to polygon count. It became a problem of navigable industrial knowledge. This is why infrastructure vendors, construction platforms, PLM providers, and manufacturing software companies all converged on web visualization as a core layer of their cloud strategies.
- WebGL gave browsers direct access to GPU-accelerated real-time 3D graphics.
- Cloud services made server-side CAD translation and derivative generation practical.
- Progressive loading allowed huge models to open without full-file downloads.
- Modern viewers became collaboration environments with permissions, markup, metadata, and APIs.
- BIM and digital twins forced web visualization to handle systems, assets, relationships, and operational context.
Conclusion: Web-Ready Visualization as a New Layer of Design Software
A convergence rather than a single invention
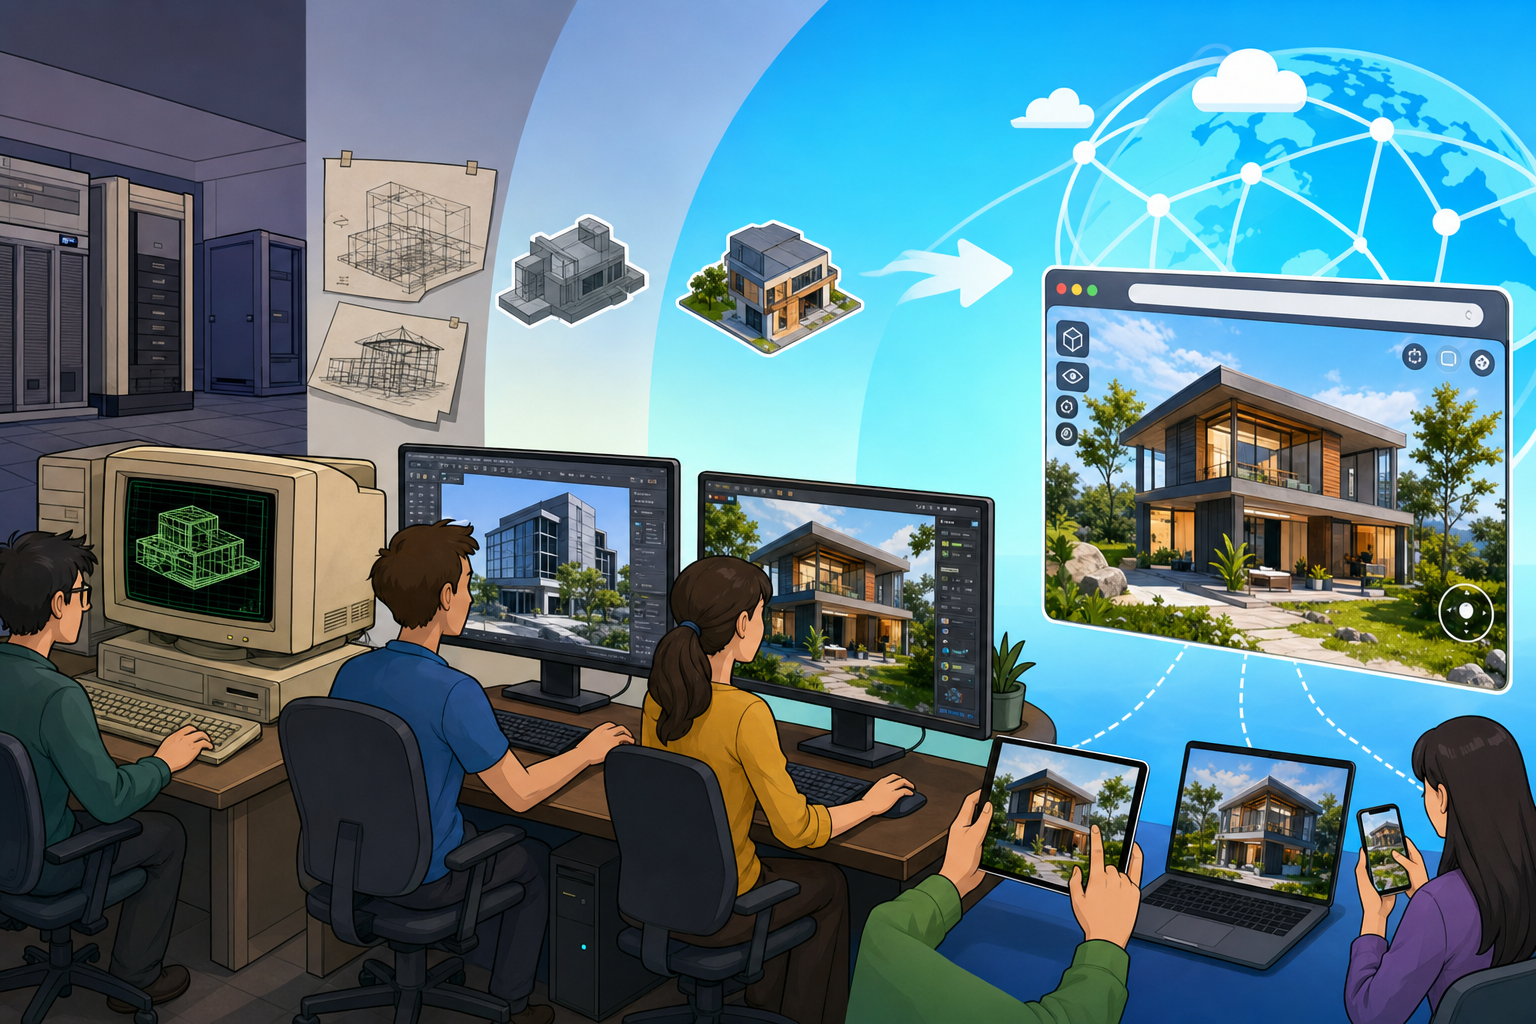
The arrival of web-ready large-scale visualization was not the result of one invention, one company, or one graphics standard. It was the outcome of decades of progress in workstation graphics, CAD kernels, tessellation algorithms, scene graph architectures, lightweight formats, web standards, compression techniques, networking, cloud computing, and GPU hardware. Silicon Graphics, Evans & Sutherland, Sun Microsystems, Hewlett-Packard, NVIDIA, Autodesk, Siemens, Dassault Systèmes, Bentley Systems, Trimble, Tech Soft 3D, PTC, Adobe, and many others each contributed pieces of the foundation. OpenGL established a durable graphics language for professional visualization. VRML and X3D explored the idea of networked 3D before the browser was ready. JT, DWF, 3D PDF, and other formats taught the industry how to separate shareable representation from full authoring data. WebGL provided the browser-native graphics bridge. Cloud platforms completed the workflow by translating, optimizing, securing, and streaming models at scale. The historical importance lies in the convergence: visualization migrated from an expensive local capability to a distributed software layer that could be embedded wherever design decisions happen.
The web viewer as a strategic design platform
The modern web viewer is no longer a passive display tool. It is a strategic design platform that sits between authoring systems, data management repositories, simulation results, procurement workflows, construction coordination, field operations, manufacturing planning, and client communication. Engineers can inspect assemblies without installing the original CAD software. Architects can review building systems with consultants and owners. Suppliers can examine only the parts of a product they are authorized to see. Contractors can coordinate spatial conflicts in federated models. Infrastructure owners can explore assets in their geographic and operational context. This transformation changed the social structure of design review. Instead of gathering around a workstation or sending static screenshots, teams can exchange links, saved views, markups, comments, and issue references. The model becomes a shared place of discussion. That shift is historically important because design software had long been centered on specialists using powerful authoring tools, while web-ready visualization opened the door for broader participation without eliminating technical rigor.
The broader impact on design collaboration
The broader impact is visible in the way complex models now travel through organizations. Large assemblies, buildings, plants, ships, aircraft interiors, factories, rail corridors, energy facilities, and city infrastructure models can be accessed through controlled web environments rather than workstation installations. This does not mean the underlying complexity disappeared. CAD translation remains difficult, exact geometry still requires careful tessellation, metadata mapping is imperfect, and very large projects continue to challenge bandwidth, memory, and graphics performance. Yet the practical threshold has changed. A stakeholder who once needed a licensed workstation application may now use a browser to navigate a model, inspect properties, measure distances, hide systems, review markups, and understand design context. That accessibility reshaped collaboration across time zones, company boundaries, and technical disciplines. It also changed expectations. Users increasingly assume that design information should be searchable, linkable, permission-aware, visually navigable, and available wherever decisions are made. In that sense, web-ready visualization turned design data into a shared navigable experience, one of the crucial steps toward today’s digital twins and cloud-native design platforms.
Also in Design News