Your Cart is Empty
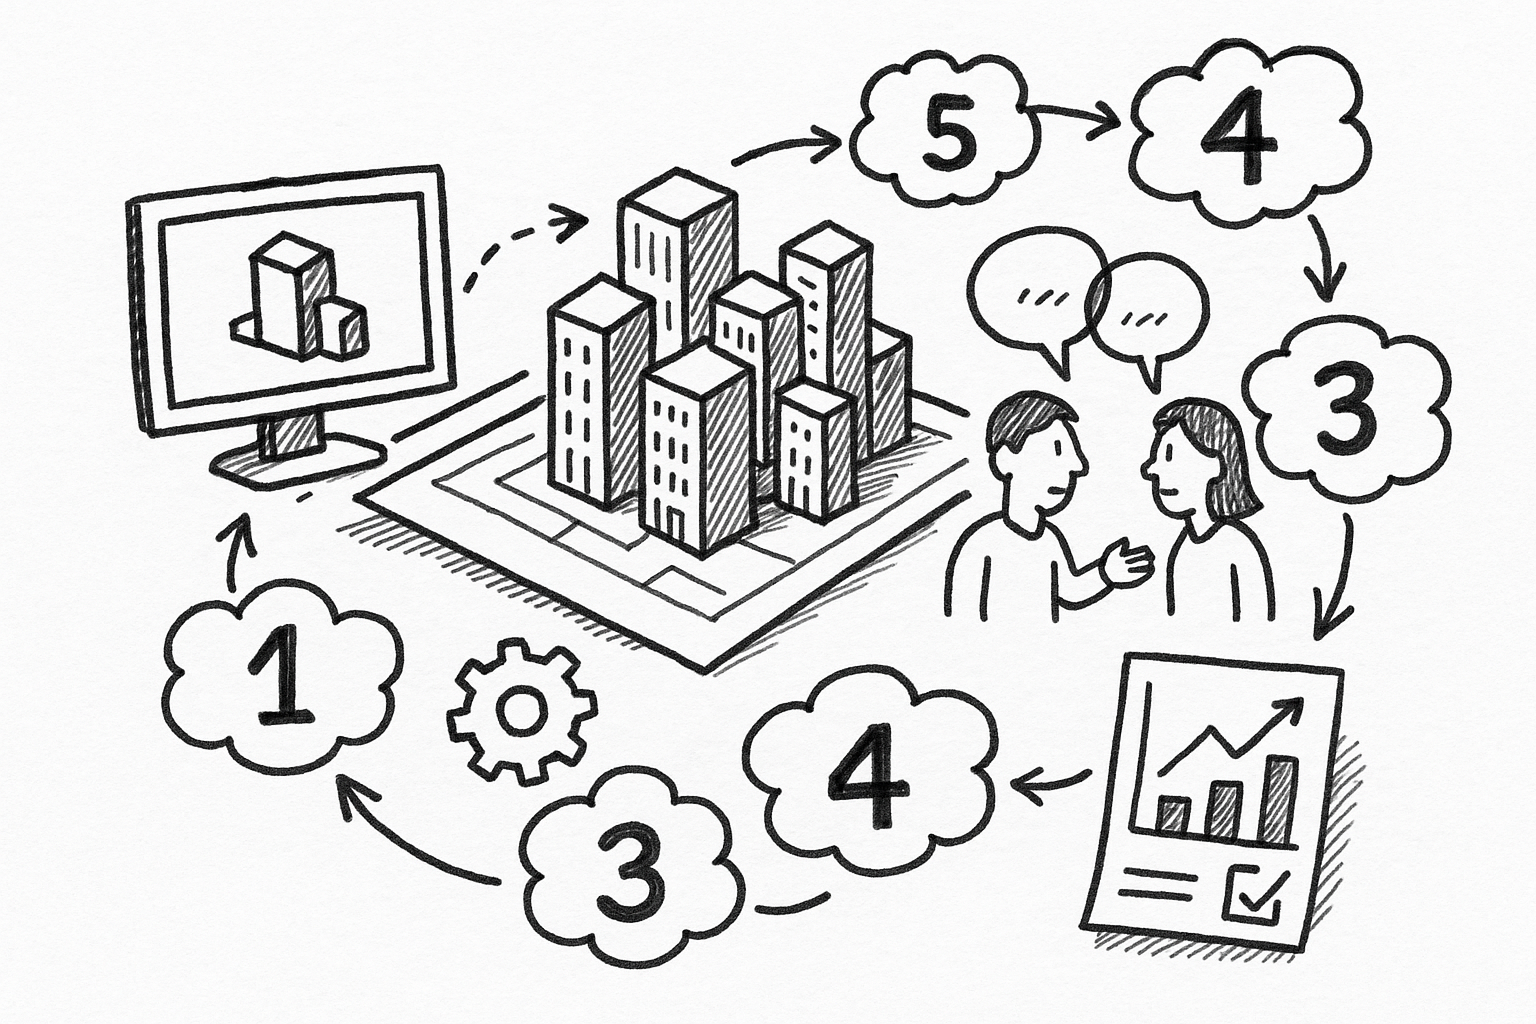
Streamlining Urban-Scale Revit Projects: Five Advanced Workflow Optimizations for Seamless Collaboration and Enhanced Efficiency


Urban-scale Revit models challenge even the most robust BIM environments. Hardware groans under the weight of millions of elements, schedules stall, and every added consultant threatens to derail version control. Yet the pressure to deliver fast, data-rich decisions never eases. The following workflow optimizations condense proven tactics into actionable steps that streamline city-district projects without sacrificing fidelity.
Master File Strategy: Linked Models, Shared Coordinates, and Worksets
At the heart of any high-density district lies a stable spatial reference. Begin with a dedicated “Site Control” file that owns the project base point, survey point, and true north. All other models inherit from this anchor, so coordinate misalignments disappear before they start. Divide the district into logical parcels—blocks, transit spines, green ribbons—and create an independent Revit file for each. Linking rather than copying geometry decentralizes processing and clarifies responsibility: architects focus on Block A, while civil engineers refine the transit corridor, all within their own performance-optimized sandboxes.
Nesting takes a back seat in this strategy. Instead of loading links inside links, rely on worksets and view filters to control visibility. Users open exactly what they need and bypass memory-heavy content they do not. A Dynamo script can automate Publish/Acquire routines every night, guaranteeing that any coordinate drift is detected while everyone sleeps. The cumulative impact is profound—benchmarks show 30–50 % faster load times once geometry ownership is properly partitioned.
- Create worksets by parcel, discipline, and shared site utilities to sharpen view templates.
- Enable selective loading so decorators or landscape teams bypass MEP internals entirely.
- Schedule a nightly shared coordinate audit; Dynamo pings violations to the BIM manager before inboxes open.
When every trade plugs into the same spatial backbone, meetings shift from frantic troubleshooting to proactive design refinement, and model stability ceases to be a moving target.
Dynamo-Driven Generative Massing for Rapid Site Iterations
Before a single facade is detailed, stakeholders want to weigh dozens of configurations against zoning, daylight, and parking ratios. Manual massing cannot keep pace, so generative scripts step in. Start by building parametric mass families whose geometric constraints mirror local zoning envelopes—setbacks, floor-area ratio, height caps. A Dynamo graph then sweeps through each parcel, spawning alternatives in seconds while tagging live parameters: gross floor area, residential versus commercial mix, stall counts, even potential solar yield.
A small set of exposed sliders—tower spacing, podium coverage, courtyard widths—transforms routine coordination meetings into live workshops. Stakeholders watch in real time as a podium shrinks to free vista corridors or a tower rotates to tame shadows across a park. Once a configuration intrigues the room, save it as a Design Option and link it back to the master. The model now hosts an auditable record of every scheme explored, each tied to quantitative KPIs. Concept turnarounds shrink from days to hours, and the data harvested in early studies seeds downstream analysis.
- Populate parcels with algorithmic variations that respect zoning yet stretch density potential.
- Schedule performance metrics on the fly—floor efficiency, glazing-to-wall ratios, daylight autonomy.
- Push preferred options to a dashboard so executives compare carbon impact side by side.
By embedding intelligence at the massing stage, teams forge a continuum where early sketches already think like buildings.
Scenario Management: Phases, Design Options, and InfraWorks Round-Tripping
Long-horizon developments rarely march forward in a straight line. Infrastructure pours years before rooftop solar arrays, and land-use allocations pivot with economic tides. Revit’s Phasing and Design Options offer twin levers for taming this complexity. Macro-phases—Infrastructure, Superstructure, Fit-Out—partition schedules and views, ensuring steel tonnage calculations do not choke on furnishings still a decade away. Meanwhile, Design Options layer speculative programs—residential towers versus civic plazas—without spawning duplicate files.
For external analysis, publish schematic models to InfraWorks to probe traffic flow, flood resilience, or storm-water retention. Simulation outputs—vehicle counts, runoff coefficients—round-trip back into Revit via Shared Views. Apply phase filters and color schemes to create logistics maps that foreground lay-down yards, haul routes, or crane arcs. The result is transparent scenario planning that renders “what-if” questions solvable during the meeting rather than weeks later.
When phases and options are woven tightly, planners toggle between fiscal timelines and experiential quality with a single dropdown, shedding the age-old friction between strategy and documentation.
Cloud Collaboration & Clash Avoidance with BIM 360 / Autodesk Construction Cloud
District-scale ambition falters if files live on scattered servers. Hosting every link on Autodesk Construction Cloud centralizes authentication, version history, and permissions—parcel by parcel, workset by workset. Automated Model Coordination queues clash detection the moment a new version uploads. Detected clashes surface as issues inside ACC and land directly in each author’s Revit inbox, ready for viewpoint navigation. No separate Navisworks session, no lost screenshots, no misfiled PDFs.
Performance hygiene remains paramount. Nightly dashboards capture file size, open time, and warning counts, flagging models that cross agreed thresholds. Design Collaboration timelines layer color-coded bubbles over package histories so architects instantly spot which MEP update affects their floor plates. The payoff is measurable: coordination meetings drop by half, and conflict-driven rework becomes the exception rather than the rule.
Equally important, cloud storage dissolves geographic barriers. Whether structural engineers in Tokyo or landscape designers in Copenhagen, each stakeholder accesses a single source of truth with latency low enough for synchronous workshops.
Data-Rich Output and Visualization for Stakeholder Engagement
A model that remains trapped inside Revit is only half alive. Extracting its data transforms geometry into persuasion. Shared parameters—floor-area ratio, unit mix, green-space ratio—stream through the Power BI Connector, feeding dashboards that executives consult before greenlighting funding rounds. Carbon metrics sit beside financial ones, underscoring sustainable choices with the same clarity as cost.
While dashboards ground decisions in evidence, immersive visualization secures emotional buy-in. Twinmotion or 3ds Max connects via Datasmith Direct Link, updating VR fly-throughs the moment glass tint or facade fins evolve. Stakeholders experience scale, light, and atmosphere long before foundations pour, accelerating approvals and aligning public perception with design intent.
For city-wide analysis, export GIS-ready layers—buildings, utilities, road networks—into ArcGIS. Planning departments overlay these against zoning maps or demographic heat data, strengthening environmental impact assessments and community outreach materials.
- Real-time dashboards juxtapose design schemes, embodied carbon, and capital expenditure.
- Datasmith keeps visualizations synchronized without manual FBX exports.
- GIS layers extend BIM intelligence to urban planners and environmental analysts.
When outputs speak both numerically and visually, stakeholders engage sooner and more deeply, turning technical compliance into genuine enthusiasm.
Conclusion
Adopting even two of these optimizations yields immediate dividends—snappier file loads, clearer decision logs, fewer midnight coordination crises. Embracing all five forges a resilient, data-centric workflow ready to scale across any mega-project. The guiding principle is simple yet potent: decentralize geometry, centralize data, and automate everything in between. In doing so, urban-scale Revit projects remain agile, intelligible, and irresistibly persuasive from concept to ribbon-cutting.
Also in Design News


