Your Cart is Empty
Design Software History: From Interchangeability to Semantic PMI: A History of Tolerancing in CAD


Origins of tolerance thinking and its first steps into CAD
From interchangeability to GD&T: the language of variation is born
Modern tolerance analysis begins with 19th‑century interchangeability, when the likes of Honoré Blanc’s musket parts and the American System of Manufacturing made repeatable fit a production imperative. By the early 20th century, Frederick Winslow Taylor and Henry Ford were converting craft assembly into flow, and tolerances became the economic contract that linked design intent to production capability. The breakthrough in representation came from Stanley Parker at the Royal Navy Torpedo Factory in the 1930s–1940s, who introduced positional tolerancing to budget variation in two dimensions rather than as independent ± limits. Parker’s ideas later crystallized into geometric dimensioning and tolerancing (GD&T), codified in ASME Y14.5 (notably the 1982, 1994, 2009, and 2018 editions) and mirrored globally by ISO’s GPS (Geometrical Product Specifications) family, especially ISO 1101 and ISO 8015. These standards reframed tolerances from linear intervals into zones tied to geometry and datum schemes, enabling designers to speak in invariants—location, orientation, form, and runout—rather than only sizes. As industries such as aerospace and automotive chased higher functional performance with lower cost, GD&T became the lingua franca across Boeing, General Motors, Ford, and their supply chains, defining how parts should mate under the real physics of assemblies.
- ASME Y14.5: datum reference frames, material condition modifiers (MMC/LMC), and position/flatness/cylindricity.
- ISO 1101 and ISO 8015: the GPS principle of independence and mathematically rigorous symbol semantics.
- Stanley Parker: positional tolerancing’s conceptual ancestor to modern feature control frames.
Hand calculations and early vectors: worst‑case thinking grows up
Before tolerance analysis moved into software, engineers did math on vellum and calculators. The prevailing methods were vector‑loop stack‑ups—summing dimension chains along an assembly path—and worst‑case arithmetic that added absolute maximums to bound the risks of interference. Practice sharpened with material condition ideas such as MMC and LMC, which define feature behavior at extremes of size and offer bonus tolerance when hardware departs from tighter limits. Educators including James D. Meadows and Alex Krulikowski translated the nuance of ASME Y14.5 into teachable, field‑proven procedures, empowering generations of designers to trace datums, select modifiers, and build defensible stacks. Yet, with pencil and spreadsheet, reality was still filtered: parts were idealized as rigid, paths were linear, and contact was simplified to algebra. The craft was invaluable—it trained intuition—but it also left money on the table because worst‑case often over‑tightened tolerances, pushing cost up to buy insurance that production might not need. As assemblies grew in complexity—multi‑branch stacks, 3D offsets, coupled orientations—the limits of manual vector math were obvious. Early adopters therefore began augmenting manual stacks with typed calculations and templates, foreshadowing the software wave that would industrialize the practice across programs and platforms.
- Vector loops captured sequence, but assumed straight‑line propagation through ideal joints.
- Worst‑case bounds were safe but conservative; root‑sum‑square (RSS) was used informally to estimate probability.
- MMC/LMC and datum shifts introduced conditional logic that was tedious to compute by hand.
Early CAD era: dimensions as graphics, tolerance math outside the model
By the late 1980s and 1990s, CAD systems—PTC Pro/ENGINEER, Dassault Systèmes CATIA V4 and later V5—replaced drafting boards with parametric solids and assemblies. But dimensions were largely graphics, not data: annotations lived as text entities, with inconsistent semantics and limited linkages to geometry kernels. Tolerances, even when displayed, did not feed engines that could propagate variation. OEMs like Boeing, GM, and Ford answered with in‑house spreadsheets and custom tools to perform historical stack‑ups alongside the CAD model. Engineers exported key dimensions, massaged them in Excel or tailor‑made codes, and reported gap‑and‑flush predictions for buyoffs and design reviews. This duality—visual intent in CAD, analytical truth in spreadsheets—created disconnects in traceability and revision control. Changes in the model could silently desynchronize the stack math; conversely, analysis assumptions weren’t captured back in the CAD. Despite the efficiency gains of parametric modeling and associative drawings, tolerance analysis remained a sidecar, a discipline adjacent to geometry but not truly embedded. That friction seeded the next transformation: if CAD could carry constraints and features, why couldn’t it also carry tolerances as computable objects that analysis software could trust and reuse?
- Dimensions were drawn, not semantically bound to features; PMI was not yet authoritative.
- Spreadsheet culture flourished: reusable chain templates, “what‑if” toggles for MMC, and RSS versus worst‑case switches.
- Custom codes proliferated at OEMs, but portability and configuration management were fragile.
From deterministic stacks to geometric‑statistical models
Worst‑case automation: the first embedded tolerance tools
As CAD matured, vendors began shipping embedded tolerance add‑ons that automated decades of manual practice. Products like SOLIDWORKS TolAnalyst and early stack‑up utilities in mid‑range systems formalized 1D chains with MMC/LMC logic, datum shifts, and quick worst‑case vs. RSS toggles. They accelerated teaching and review by tying chain paths to faces and edges inside the model, but assumptions remained: parts were treated as rigid, the chain followed a linear path, and contact was idealized. Still, this was a breakthrough for design teams pressed for time. The tools enforced syntax (e.g., datum order, modifier legality) and provided a common, visual way to communicate stacks during gate reviews. Crucially, they made tolerance analysis discoverable for non‑experts, creating a user base that would later step up to 3D geometric engines. The market learned a key lesson: automation must be backed by a clear data model, or else engineers won’t trust the results. That realization collided productively with advances emanating from the French school of geometrical tolerancing, which supplied the mathematics to leave 1D behind and compute in true 3D.
- Embedded chain tools reduced transcription errors and sped up “first‑order” checks.
- Limits: rigid parts, linear propagation, and no compliant deformation or 3D datum kinematics.
- Educational value: enforceable syntax and visual chains improved organizational consistency.
Geometry‑aware foundations: SDT, TTRS, and constraint algebra in kernels
The leap from deterministic chains to full 3D variation depended on geometric kinematics. Researchers such as Pierre Bourdet, Jean‑Claude Clément, and Gérard Mathieu developed Small Displacement Torsors (SDT), representing infinitesimal translations and rotations as 6‑component screw vectors, enabling linearized propagation of geometric errors through assemblies. Complementary frameworks like TTRS (Technologically and Topologically Related Surfaces), notably advanced by Clément and Alain Desrochers, mapped how manufacturing processes couple surfaces and constrain degrees of freedom. Together, SDT and TTRS established a disciplined way to connect datum reference frames, constraints, and manufactured features to kinematic behavior. Commercial kernels gradually absorbed these ideas: CAD systems and analysis engines began to model datum features, modifiers, and material conditions as algebra over constraints, not just drawing symbols. A positional tolerance ceased to be a visual note; it became a bounded region in 6D space, intersected with joints and contact, from which sensitivity matrices could be derived. This geometric rigor allowed tools to express realistic behaviors such as datum mobility under RFS vs. MMC, and to compute how orientation errors couple into location deviations in multi‑stage assemblies. The outcome was a viable bridge from GD&T semantics to numerical simulation.
- SDT: linearizes small rotations/translations, enabling Jacobian‑based propagation of error in 3D.
- TTRS: captures process‑induced relationships among surfaces and their kinematic constraints.
- Modern kernels: material condition modifiers alter constraint bounds; datum precedence defines mobility.
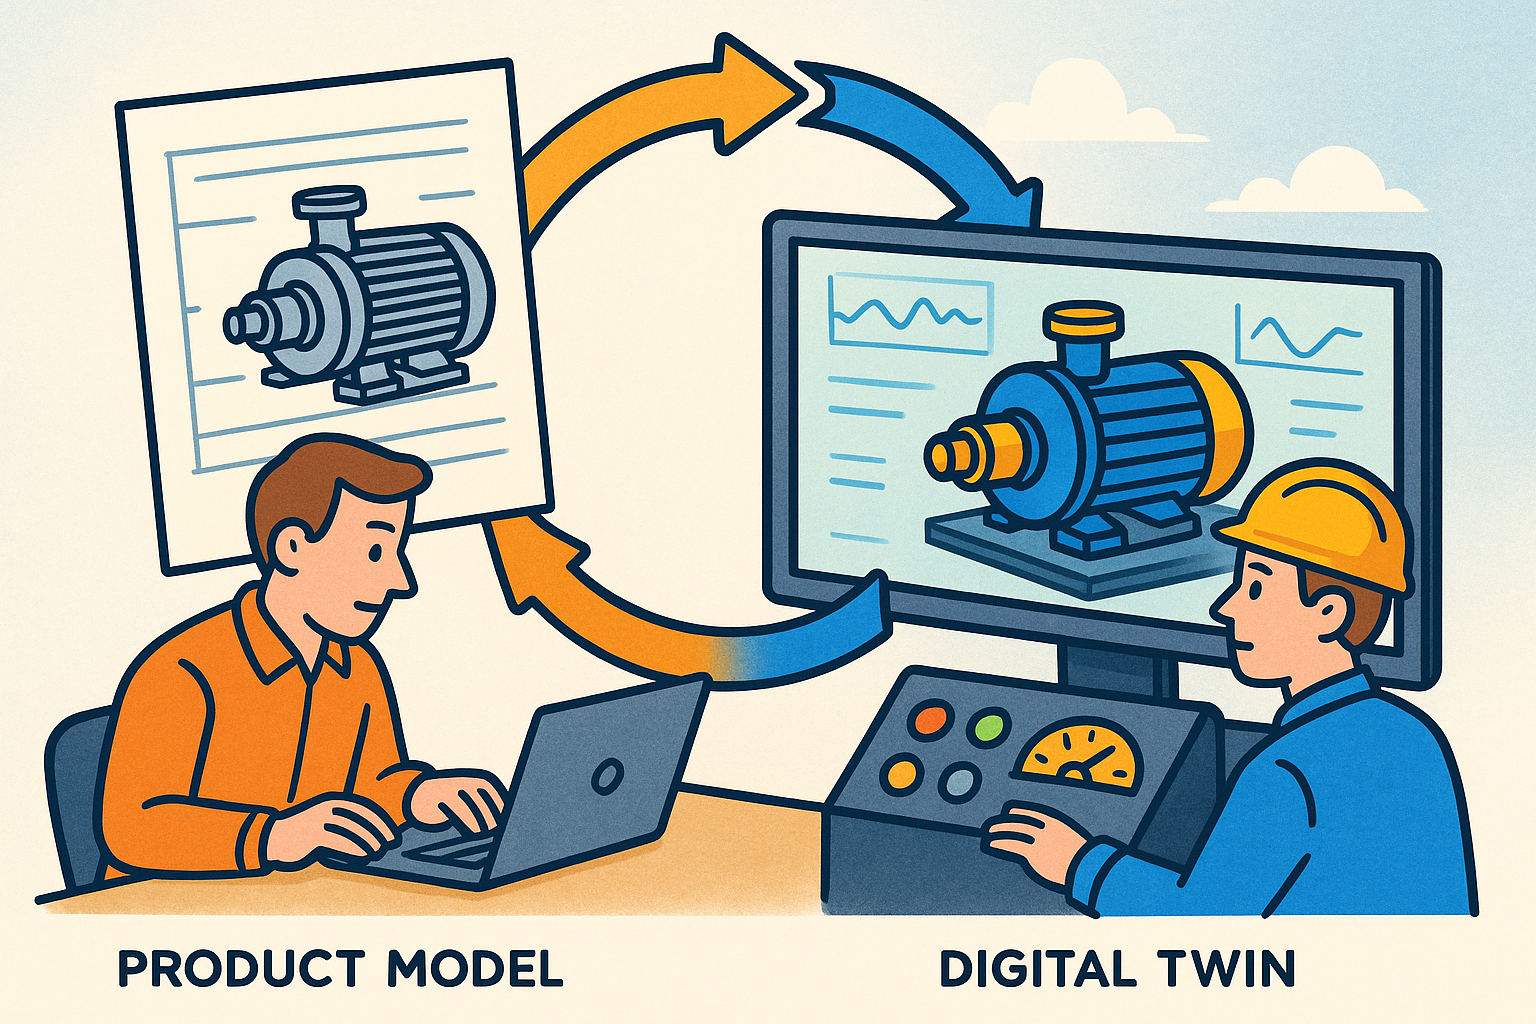
Semantic PMI unlocks analysis: FTA, NX PMI, Creo MBD, and STEP AP242
However elegant the math, analysis is only as good as the data entering it. The decisive unlock came from semantic PMI—machine‑readable product and manufacturing information embedded in CAD. Dassault Systèmes’ CATIA FTA (Functional Tolerancing & Annotation), Siemens NX PMI, and PTC Creo MBD transformed GD&T from drawing‑like notes into objects with references to faces, edges, and features. With attributes like modifiers, datum targets, and feature‑of‑size definitions represented explicitly, analysis tools could subscribe to the PMI and build stacks directly from authoritative design intent. Neutral standards followed: STEP AP242 introduced rich PMI support for exchange, while NIST’s PMI test suites and conformance initiatives validated semantic correctness across vendors. This reduced vendor lock‑in and ensured that the PMI used in a tolerance analysis in one system meant the same thing when exchanged via STEP or consumed by metrology. The effect was both practical and cultural. Engineers could build a true digital thread from design to analysis to inspection, while organizations began treating PMI as the single source of truth rather than as a documentation artifact. Analysis scripts no longer parsed text; they traversed feature graphs with stable identifiers, laying the groundwork for robust model‑based enterprises.
- CATIA FTA, NX PMI, Creo MBD provide authoritative, associative GD&T tied to geometry.
- STEP AP242 PMI and NIST test suites foster interoperability and reduce semantic drift.
- Semantic PMI closes the loop to CMMs and scanners, enabling automatic plan generation and feedback.
Commercial tolerance‑analysis systems: VSA, CETOL 6σ, 3DCS, and RD&T
Armed with semantics and geometry, a new generation of commercial systems took the field. VSA (originating from VSA Corporation, later acquired by UGS and then Siemens) embedded assembly‑centric 3D stacks within Teamcenter and NX, appealing to large OEMs standardizing processes across global programs. CETOL 6σ by Sigmetrix, closely integrated with Pro/ENGINEER and later Creo, brought sensitivity/Jacobian‑based propagation and deep Six Sigma workflows—Cp/Cpk targets, tolerancing to yield, and design for capability—to mainstream mechanical design. 3DCS Variation Analyst from Dimensional Control Systems spanned CATIA, NX, Creo, and SOLIDWORKS, blending analytical math with Monte Carlo simulation and optionally compliant FEA for sheet metal and plastics. In Scandinavia, RD&T—rooted in research at Chalmers University of Technology, with figures like Rikard Söderberg advancing variation modeling—popularized SDT‑driven analysis across Volvo and other Nordic manufacturers. These platforms translated GD&T and assembly constraints into solvable models, supported datum mobility, contact, and fasteners, and delivered results as sensitivities, distributions, and risk metrics that engineering leadership could act on. Importantly, they integrated with PLM for versioning, security, and traceability, aligning tolerance decisions with enterprise workflows and supplier collaboration.
- VSA (Siemens): assembly‑first modeling, tight Teamcenter linkage for large program governance.
- CETOL 6σ (Sigmetrix): Jacobian engines, DOE, and yield‑based allocation inside Creo/Creo+ and other CAD.
- 3DCS (DCS): hybrid math + simulation, compliant modules, broad CAD footprint in automotive and aerospace.
- RD&T: strong SDT pedigree, widely used in Scandinavian automotive for fixture and locator planning.
Statistical and Monte Carlo revolutions—and the digital thread
Six Sigma normalizes statistical tolerancing beyond RSS
The 1990s and 2000s saw manufacturing embrace Six Sigma as a managerial and technical framework. Pioneers like Motorola’s Bill Smith and later champions including Mikel Harry pushed Cp/Cpk metrics, DMAIC processes, and data‑driven decision‑making into the mainstream. For tolerance analysis, this legitimized moving beyond worst‑case and ad‑hoc RSS approximations to probabilistic thinking grounded in capability. Instead of designing every interface for 0 ppm risk, teams began designing for target yield, informed by process Cp/Cpk and strategic buffers. Tools like CETOL and 3DCS embedded statistical models, enabling engineers to assign distributions to dimensions, model correlations from common tooling or process steps, and compute Ppk for functional requirements such as gap‑and‑flush or torque‑to‑turn. Statistical tolerancing, once a contentious trade between cost and risk, became a disciplined practice tethered to real measurement data. The cultural shift mattered as much as the math: quality leaders could now connect allocation to business metrics—scrap, rework, warranty—and build governance around maintaining statistical capability across program phases, from prototype to ramp to steady‑state.
- Cp/Cpk/Ppk tie tolerance allocations to process reality rather than abstract arithmetic limits.
- DMAIC cycles institutionalize continuous improvement using measured variation.
- Statistical tolerancing moves decisions from “always worst‑case” to “yield‑to‑target with capability”.
Algorithms and workflows mature: Jacobians, correlations, contact, and compliance
Methodologically, the toolchain diversified. Direct linearization via Jacobians offered fast sensitivity analysis: partial derivatives mapped input variations (dimensions, form errors, datum shifts) to outputs (gaps, interferences), enabling design‑of‑experiments and rapid “what‑if” allocations. RSS remained a convenient summary for uncorrelated, small variations, but real assemblies often carry correlations—common fixtures, shared machining steps, assembly sequences that multiply or cancel errors. Tools incorporated correlation matrices and path‑dependent assembly logic, simulating locator engagement, clamp order, and torque effects. Contacts evolved from idealized mates to inequality constraints with potential stick/slip logic; datum simulations modeled mobility under RFS, MMC, and LMC with bonus tolerances and shift. Critically, industries reliant on thin‑gauge materials—BIW, appliances, consumer electronics—needed compliant variation analysis: FEA‑in‑the‑loop workflows that deform sheet metal, plastics, and trim based on stiffness and boundary conditions. Vendors responded with compliant modules (e.g., 3DCS Compliant Analyzer, CETOL‑FEA coupling) that could predict realistic gap and flush, clip engagement, and torque‑to‑close, calibrating stiffness from CAE or test. The result: algorithms that reflect both kinematic and elastic realities, applied through workflows that mirror how factories actually build products.
- Direct linearization for speed; Monte Carlo for nonlinearity and non‑Gaussian tails.
- Correlation and sequence modeling capture common‑cause variation and assembly order effects.
- Compliant analysis unlocks accurate predictions for thin, flexible parts and adhesive/clip joints.
Monte Carlo at scale: sampling innovations and hybrid strategies
While first‑order sensitivity is fast and insightful, many tolerance problems are nonlinear: contact conditions change, datum shifts saturate, and stacking through branches can induce non‑Gaussian outputs. Monte Carlo simulation became the workhorse for capturing these realities. To control run‑time without sacrificing fidelity, tools adopted advanced sampling: Latin Hypercube Sampling to efficiently stratify inputs, low‑discrepancy sequences (e.g., Sobol) for better space‑filling, and variance‑reduction techniques such as importance sampling, control variates, and antithetic pairs to resolve tail risks. Hybrid methods that combine Jacobian sensitivities with guided sampling emerged, steering samples toward high‑impact regions of the input space. For large assemblies, cloud execution and parallelism allowed millions of trials, enabling robust estimation of extreme quantiles linked to warranty risk. Result reporting matured as well: not only histograms, but contribution analyses, tornado charts, and Pareto views tied drivers to features and processes. This made tradeoffs tangible: move a locator, retarget a drilling operation’s Cp, or change a fastener strategy—and immediately see shifts in predicted yield and cost.
- Latin Hypercube and Sobol sequences reduce sample counts for a given accuracy target.
- Variance reduction resolves tails crucial to risk‑based decisions and escape detection.
- Hybrid sensitivity‑guided MC balances speed and fidelity for complex assemblies.
Enterprise integration: PLM backbones, MBD, and closed‑loop quality
By the mid‑2010s, the vision of a digital thread materialized. PLM platforms—Siemens Teamcenter, Dassault Systèmes 3DEXPERIENCE, and PTC Windchill—began orchestrating MBD authoring, tolerance analysis, change control, and supplier exchange. In automotive BIW programs, gap‑and‑flush targets, kitting strategies, locator schemes, and rework plans were validated upstream using CETOL, 3DCS, or VSA, then flowed downstream to tooling and metrology. QIF (Quality Information Framework) from the DMSC bridged design and inspection: PMI from STEP AP242 or native CAD drove automated inspection plan generation; CMM and scanner results returned as QIF‑ML, linking measured features back to the authoritative model. NIST’s Model‑Based Enterprise initiatives and PMI test suites verified semantic correctness so that analysis and inspection consumed the same intent. With closed‑loop quality, capability indices updated allocations: if a supplier delivered higher Cp than expected, tolerances could be relaxed; if capability sagged, designs flagged risk with quantified fallout. This enterprise framing also tackled governance: access control, version lineage, effectivity, and context ensured that every tolerance decision could be audited against the exact CAD/PMI state and measured reality used to justify it.
- Teamcenter, 3DEXPERIENCE, Windchill manage the lifecycle of PMI, analysis models, and change.
- QIF closes the loop, making inspection results computable feedback to design.
- STEP AP242 PMI serves as the neutral vessel to move intent across tools and partners.
Conclusion
The arc, the enablers, and the stubborn challenges
The journey runs from hand‑drawn stacks to embedded, geometric‑statistical models inside CAD/PLM. What began as deterministic worst‑case arithmetic on vector loops matured into 3D kinematic representations via SDT/TTRS, overlaid with Six Sigma statistics, and accelerated by Monte Carlo simulation and hybrid sensitivity methods. That arc was made possible by three converging forces. First, semantic PMI—CATIA FTA, NX PMI, Creo MBD—turned annotations into computable contracts tied to geometry. Second, neutral standards—STEP AP242 for PMI exchange and QIF for measurement—enabled interoperable workflows and feedback. Third, robust 3D methods—SDT, constraint algebra, Jacobians—gave solvers the physics to honor datum mobility, contact, and form errors. Yet, authentic obstacles remain. Nonlinear contacts with friction and assembly strategies under compensators defy simple linearization. PMI attachment still wrestles with topological naming stability during design changes, risking orphaned or misapplied tolerances. The variability of additive manufacturing introduces anisotropic, process‑dependent correlations hard to capture with classic Cp/Cpk. And beyond all, enterprises struggle to map real process correlations—operators, fixtures, environmental factors—into models in a maintainable way. Overcoming these will demand better kernels, smarter data models, and governance practices that treat variation as a first‑class system property, not a late‑stage fix.
- Semantic PMI and neutral standards convert documentation into executable intent.
- 3D kinematic and elastic models honor datum, contact, and compliance realism.
- Key gaps: nonlinear contacts, stable PMI attachments, additive variability, and correlation capture.
What’s next: AI allocation, cloud‑scale simulation, and standards‑led automation
The next decade will push tolerance analysis from expert tool to ubiquitous, automated co‑pilot. AI will assist tolerance allocation by learning from historical programs, correlating PMI patterns, materials, and process plans with capability outcomes to propose allocations that hit yield and cost simultaneously—complete with explainable sensitivity rationales. Design‑of‑experiments will expand from part‑level to full assemblies, with active learning guiding which dimensions, locators, or process Cp improvements deliver the best ROI. Cloud‑scale Monte Carlo will fuse with digital twins, streaming CAE‑derived stiffness, metrology feedback via QIF, and process control data to sustain live risk forecasts during ramp and production. Meanwhile, standards bodies will continue turning GD&T into executable manufacturing intent: richer PMI schemas for datum targets and modifiers, API conventions for simulation handoff, and certification suites that grade not only rendering fidelity but also computational compliance. The most competitive organizations will close the loop end‑to‑end—author PMI once, simulate, allocate, flow to tooling and inspection, collect data, update capability models, and re‑issue allocations—treating variation as an asset to be optimized. The outcome is a discipline that began in pencil and paper but now stands as a strategic lever connecting design, manufacturing, and quality through a resilient digital backbone.
- AI‑assisted tolerance allocation with explainability tied to sensitivities and historical capability.
- Cloud‑native Monte Carlo combined with live metrology and process signals in operational digital twins.
- Standards‑led automation that makes PMI executable across CAD, PLM, CAM, and inspection ecosystems.
Also in Design News